Forecasting hypoxia and algal blooms in estuaries
My PhD research at North Carolina State University: statistical and mechanistic models that forecast, and help prevent nutrient-driven water quality problems in estuaries and coastal waters.
Eutrophication is the enrichment of natural waters with nutrients from human activity, such as agricultural fertilizer and wastewater. It promotes harmful algal blooms and hypoxia (dissolved oxygen below 2 mg/L), which damage fisheries, ecosystems and water supplies. According to NOAA, 65% of the estuaries and coastal waters in the US are moderately to severely degraded by excess nutrients, and the conservative estimate of damage from eutrophication in US freshwaters alone is about $2.2 billion a year.
Neuse River EstuaryGulf of MexicoPublications
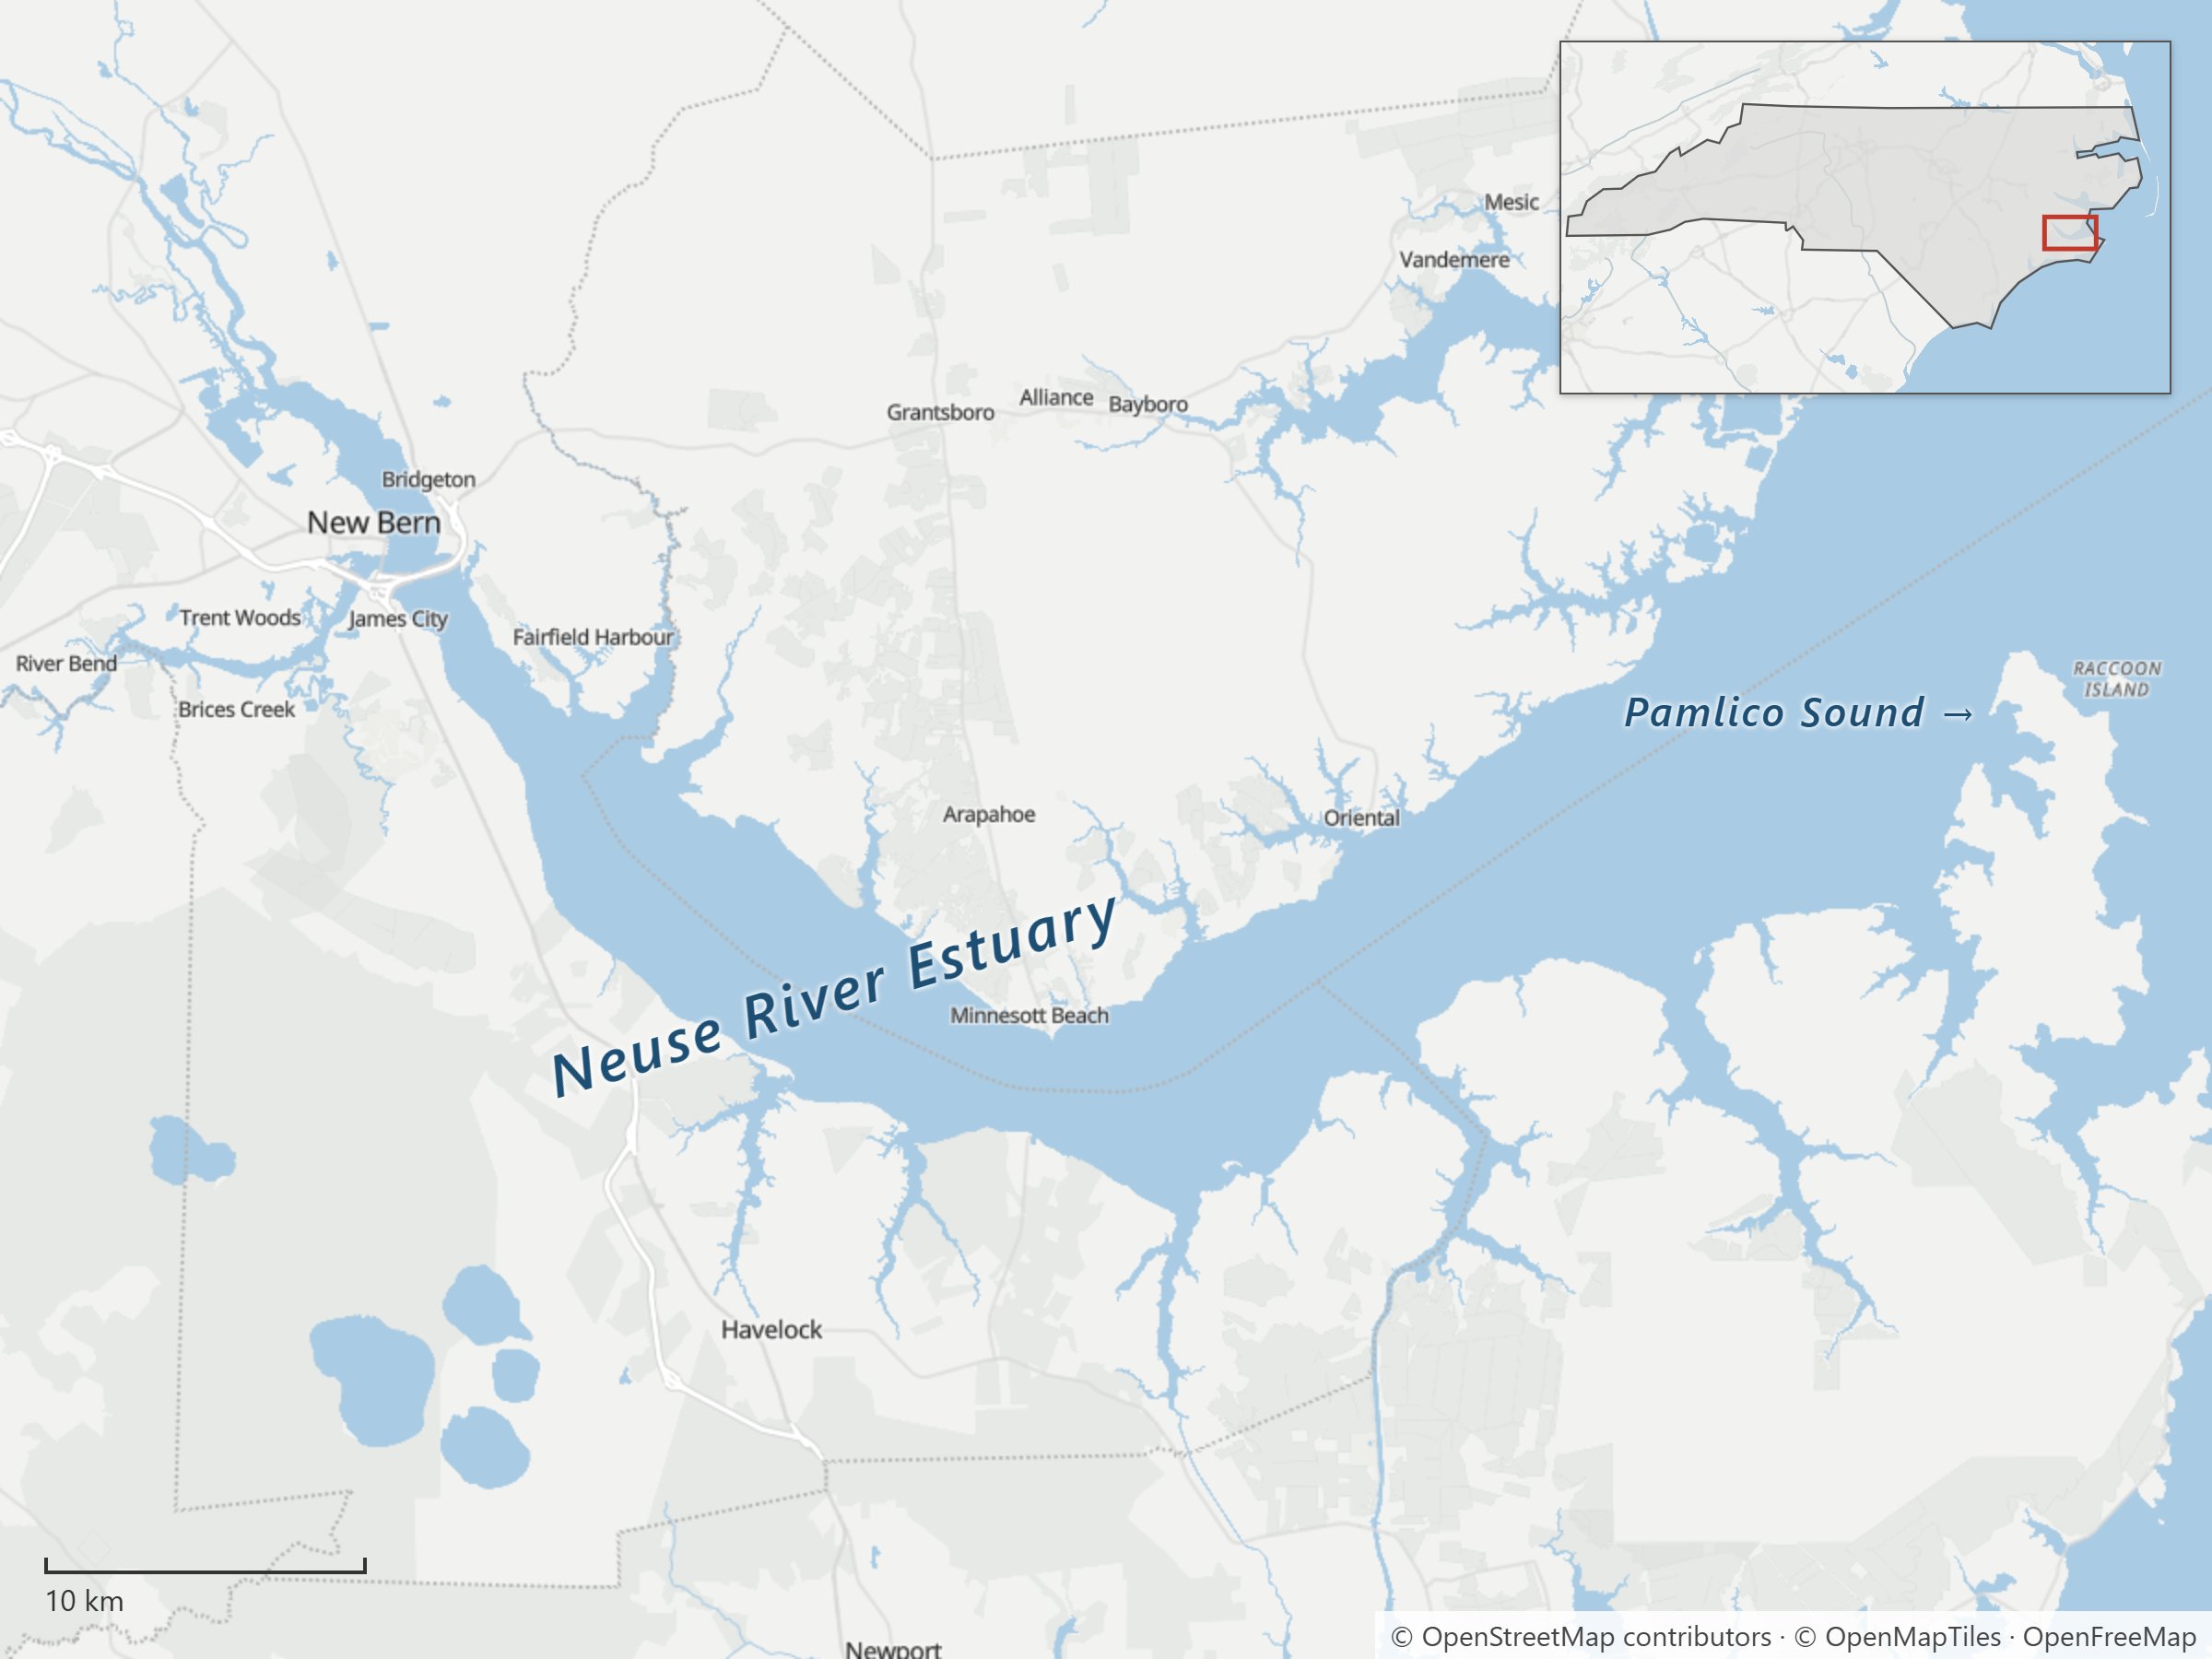
Neuse River Estuary
The Neuse River Estuary in southeastern North Carolina has had hypoxia, algal blooms and fish kills for over two decades, attributed to rising nutrient loads from a fast-growing watershed. I built mechanistic and empirical models of near-bottom dissolved oxygen and of chlorophyll a, a proxy for algal blooms.
Hypoxia
A process-based biophysical model describes, with differential equations, how hydrologic, meteorologic and human influences drive near-bottom oxygen in time and space. It is calibrated in a Bayesian framework, which estimates uncertain rate parameters from prior scientific knowledge and historical data.
Higher winter river discharge increases flushing and leaves less time to produce and settle organic matter, which raises oxygen in summer. Sediments are the dominant oxygen sink, but hypoxia can still be reduced by seasonal cuts in nutrient loading.
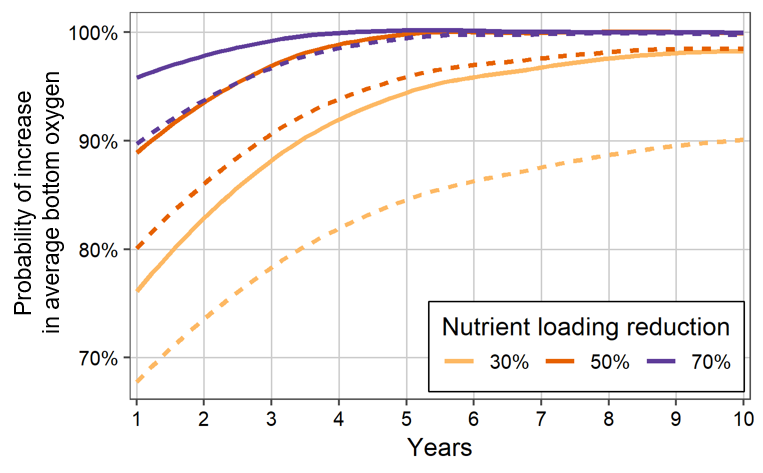
Because the predictions are probabilistic, they give the chance of seeing an improvement under different nutrient regulations. With a 30% loading reduction and sampling twice a month (current practice), it would take about 10 years to be 90% confident of an increase in mean May-October near-bottom oxygen.
The same model forecasts hypoxia from river flow and nutrient loads. I produced the annual summer Neuse hypoxia forecast starting in 2018:
- Summer 2021 Hypoxia Forecast: Fish Kills Less Likely Than Usual in the Neuse River Estuary 2021
- Midsummer Neuse River Forecast Shows Greater Potential for Fish Kills 2020
- Researchers Forecast Healthier Neuse River Oxygen Levels 2019
- Tropical Systems Disrupt Neuse River Oxygen Levels 2018
- Model Forecasts Severe Hypoxia through August in Neuse Estuary 2018
Algal blooms
I built and compared a hierarchical piecewise regression and a mechanistic model of chlorophyll a, both calibrated with Bayesian inference (Hamiltonian Monte Carlo in Stan for the regression, an adaptive Metropolis algorithm for the mechanistic model). The regression found a strong effect of river discharge, with a change point that depends on the size of the flow. For nutrient management scenarios the process-based model is preferable, because it describes the biochemical mechanisms explicitly.
Nitrogen is the main nutrient limiting phytoplankton growth, even under phosphorus reductions, and the limitation is stronger in dry conditions. Reducing nutrient concentrations, rather than total loads, is the key to controlling chlorophyll a. The process-based model predicts that a 10% change in nitrogen loading (flow held constant) changes estuary chlorophyll a by about 4.3%; the regression implied a larger and likely unrealistic 10%.
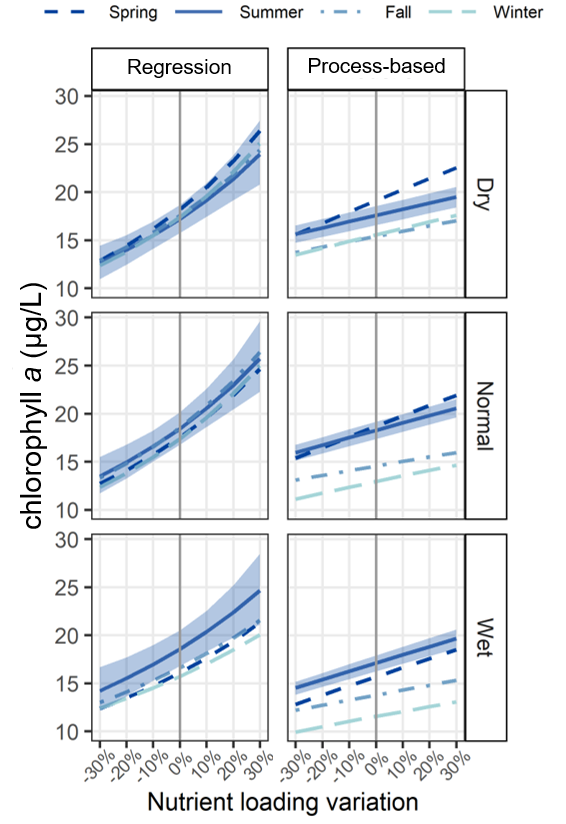
Taken together, a 30% nutrient loading reduction would lower chlorophyll a by about 14% and the number of hypoxic days by about 25%.
Gulf of Mexico
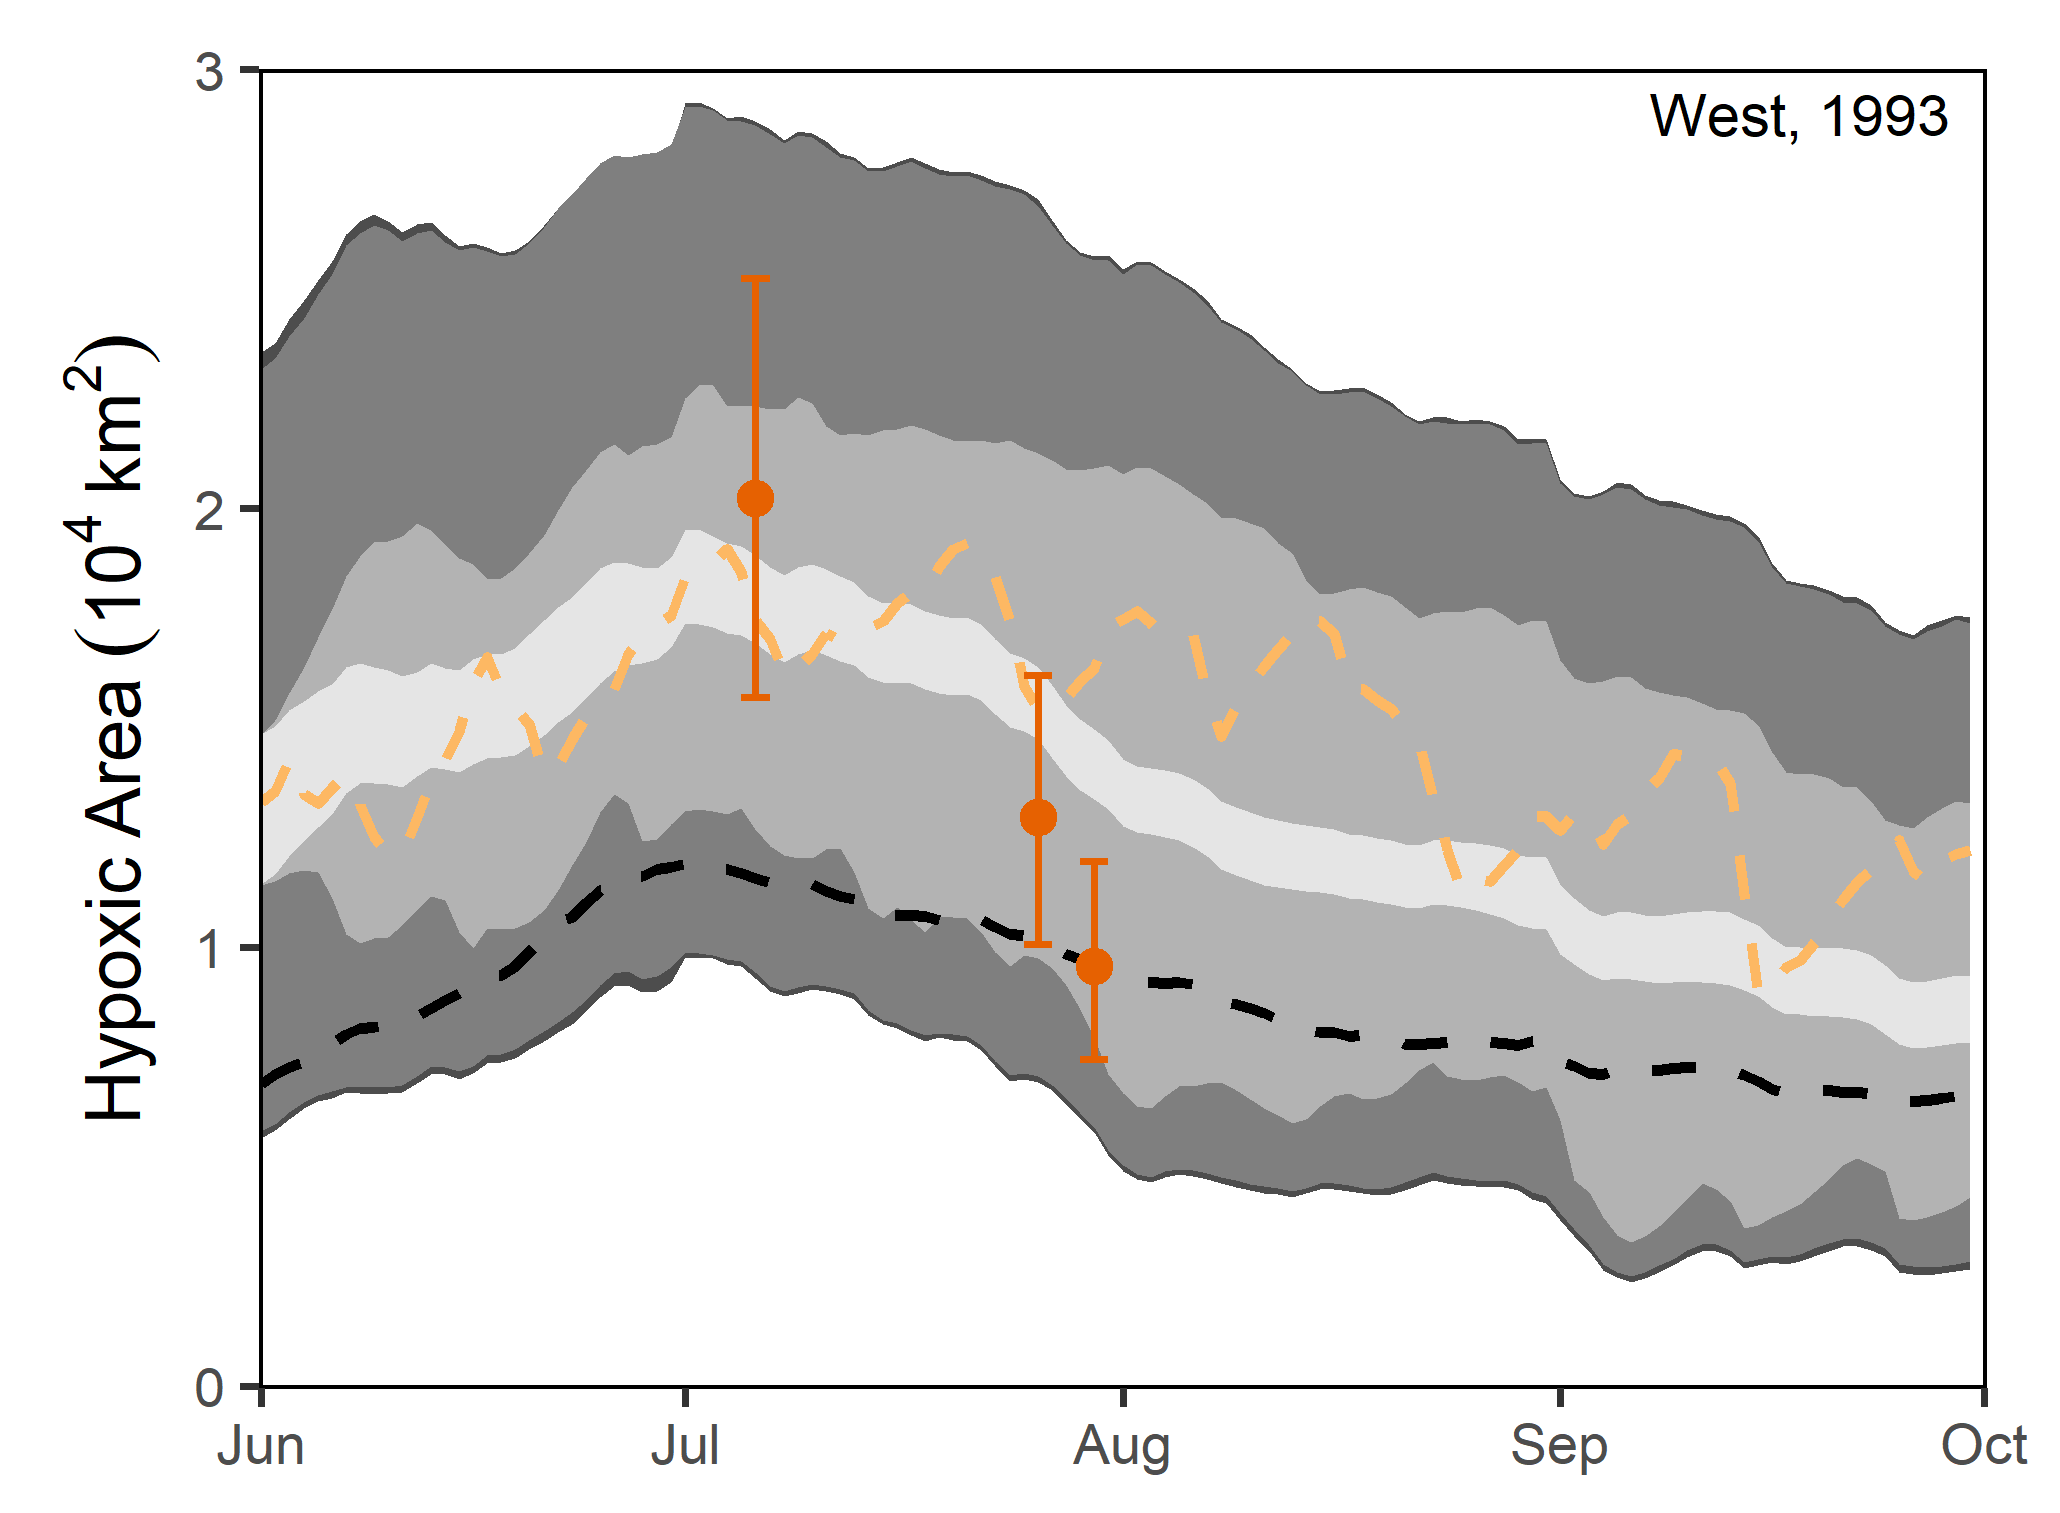
A low-oxygen zone forms each summer in the northern Gulf of Mexico and affects the distribution of commercially important fish and shellfish. Most existing forecasts use only spring nitrogen load and report only late-July conditions, while fisheries are active across the whole summer.
Daily hypoxia forecasts
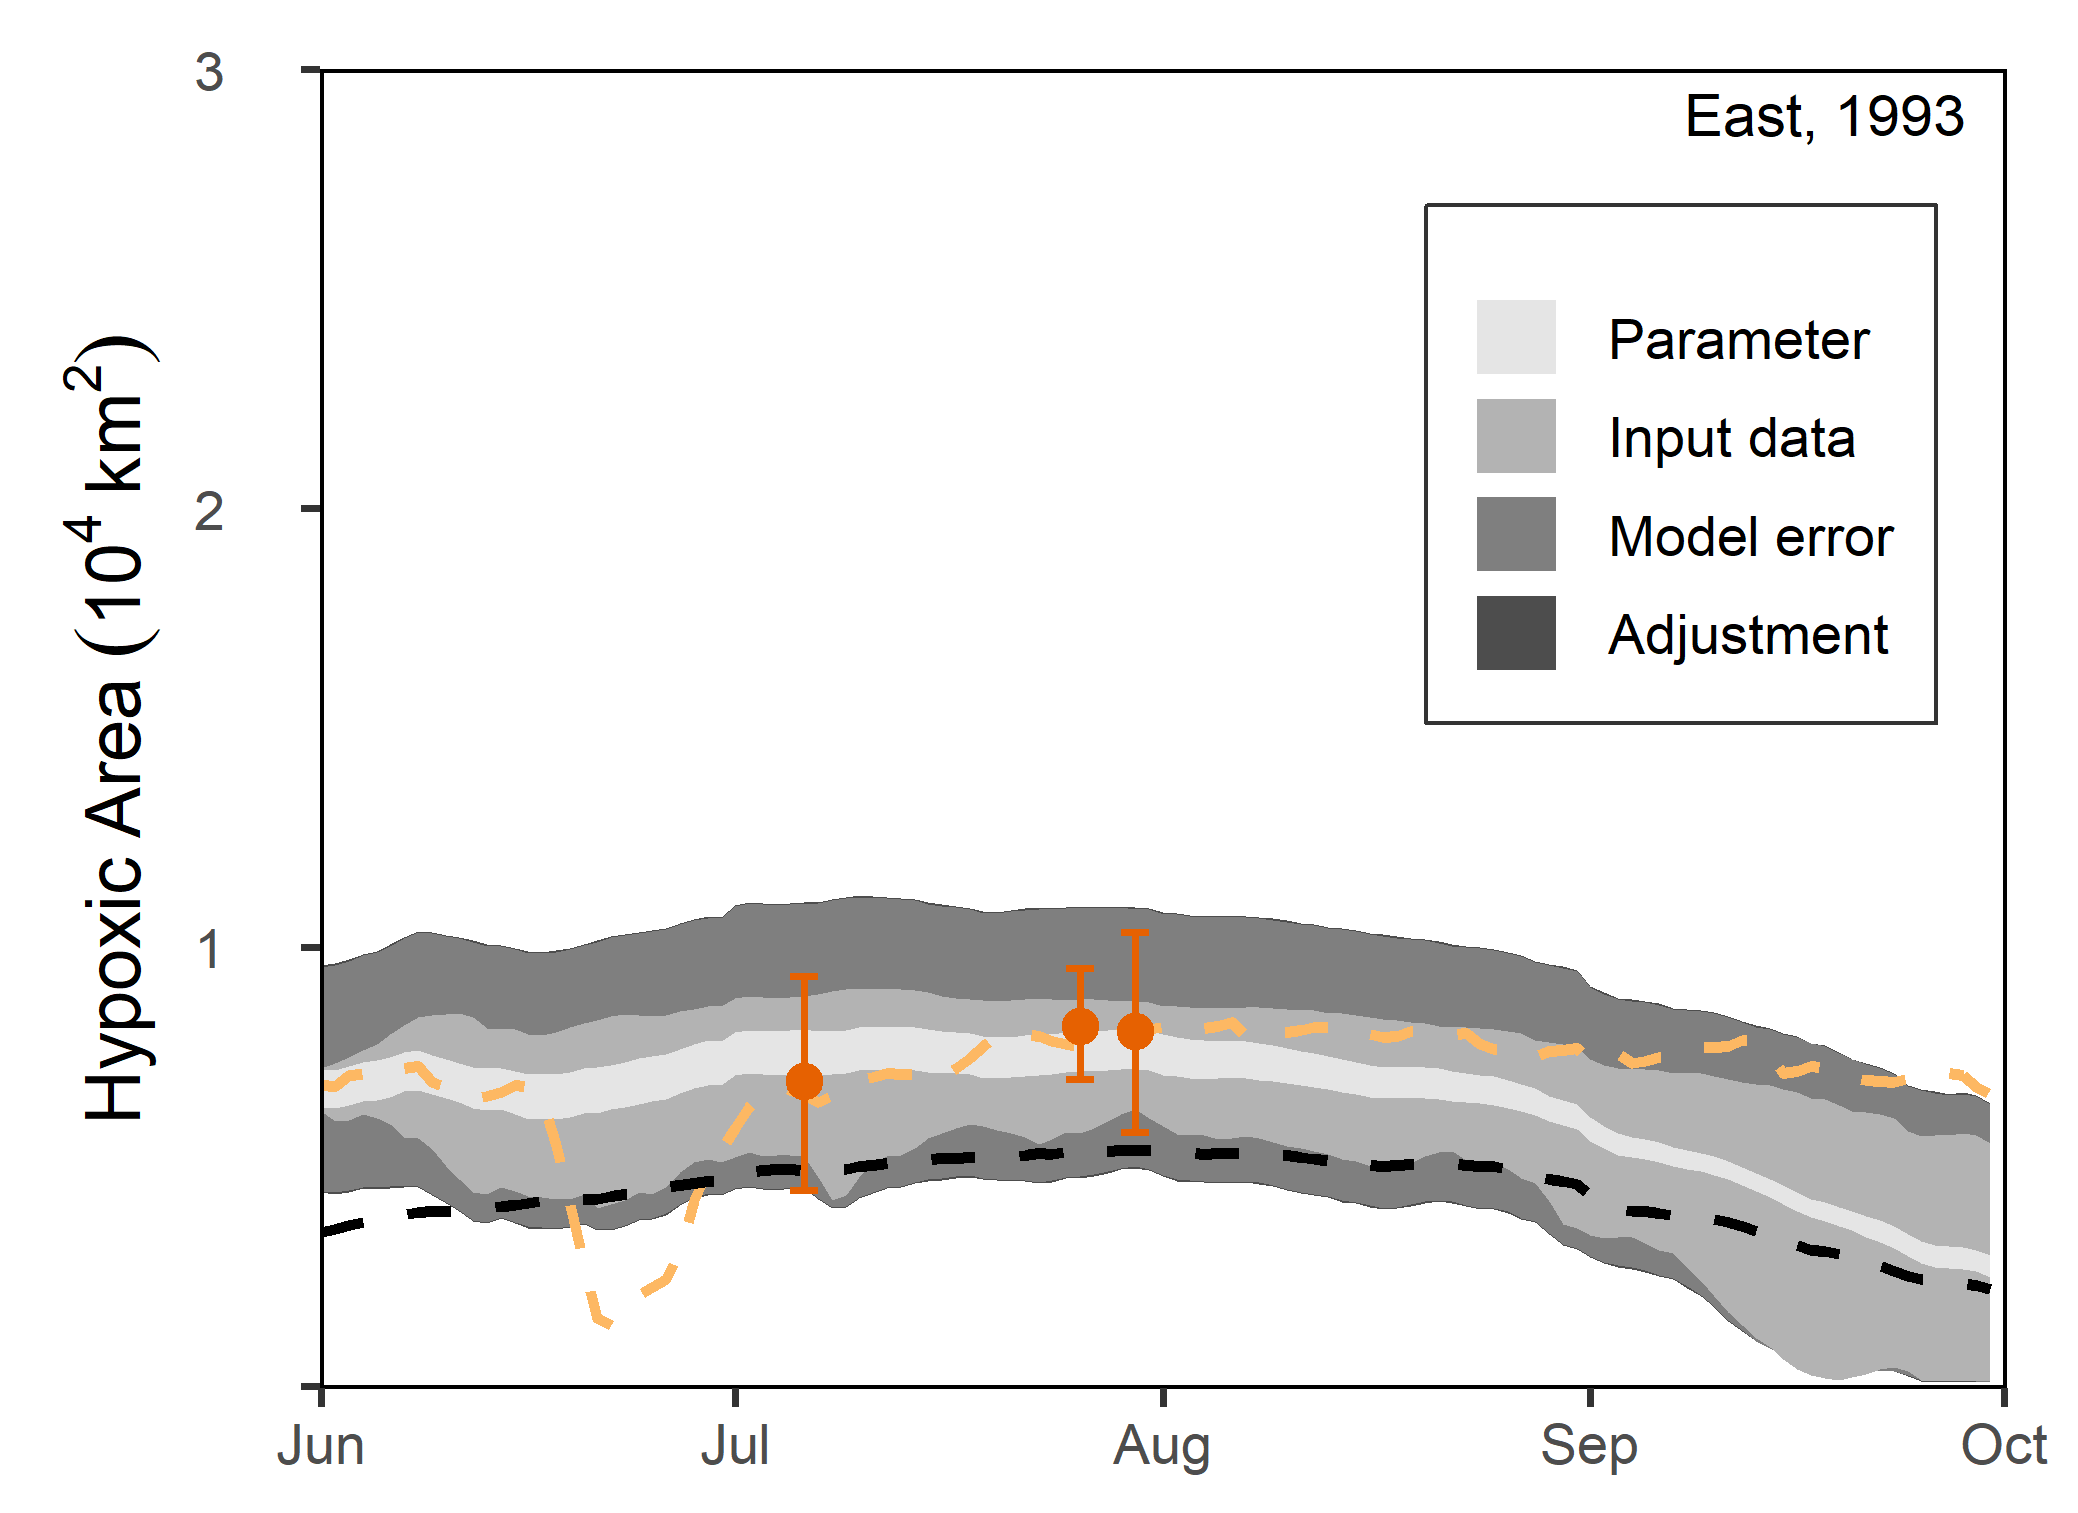
I built a forecasting system on a Bayesian mechanistic model that gives dissolved oxygen and hypoxic area at daily resolution, with up to four months of lead time, and separates the uncertainty coming from parameters, river and weather inputs, and model error. Constraining summer river inputs with spring conditions, including precipitation over the Mississippi River basin, improves forecast skill, and spring wind data improves it further. Retrospective forecasts explain about 50% of the temporal variability in hypoxic area for both sections of the Louisiana-Texas shelf (1985-2016).
Shrimp distributions
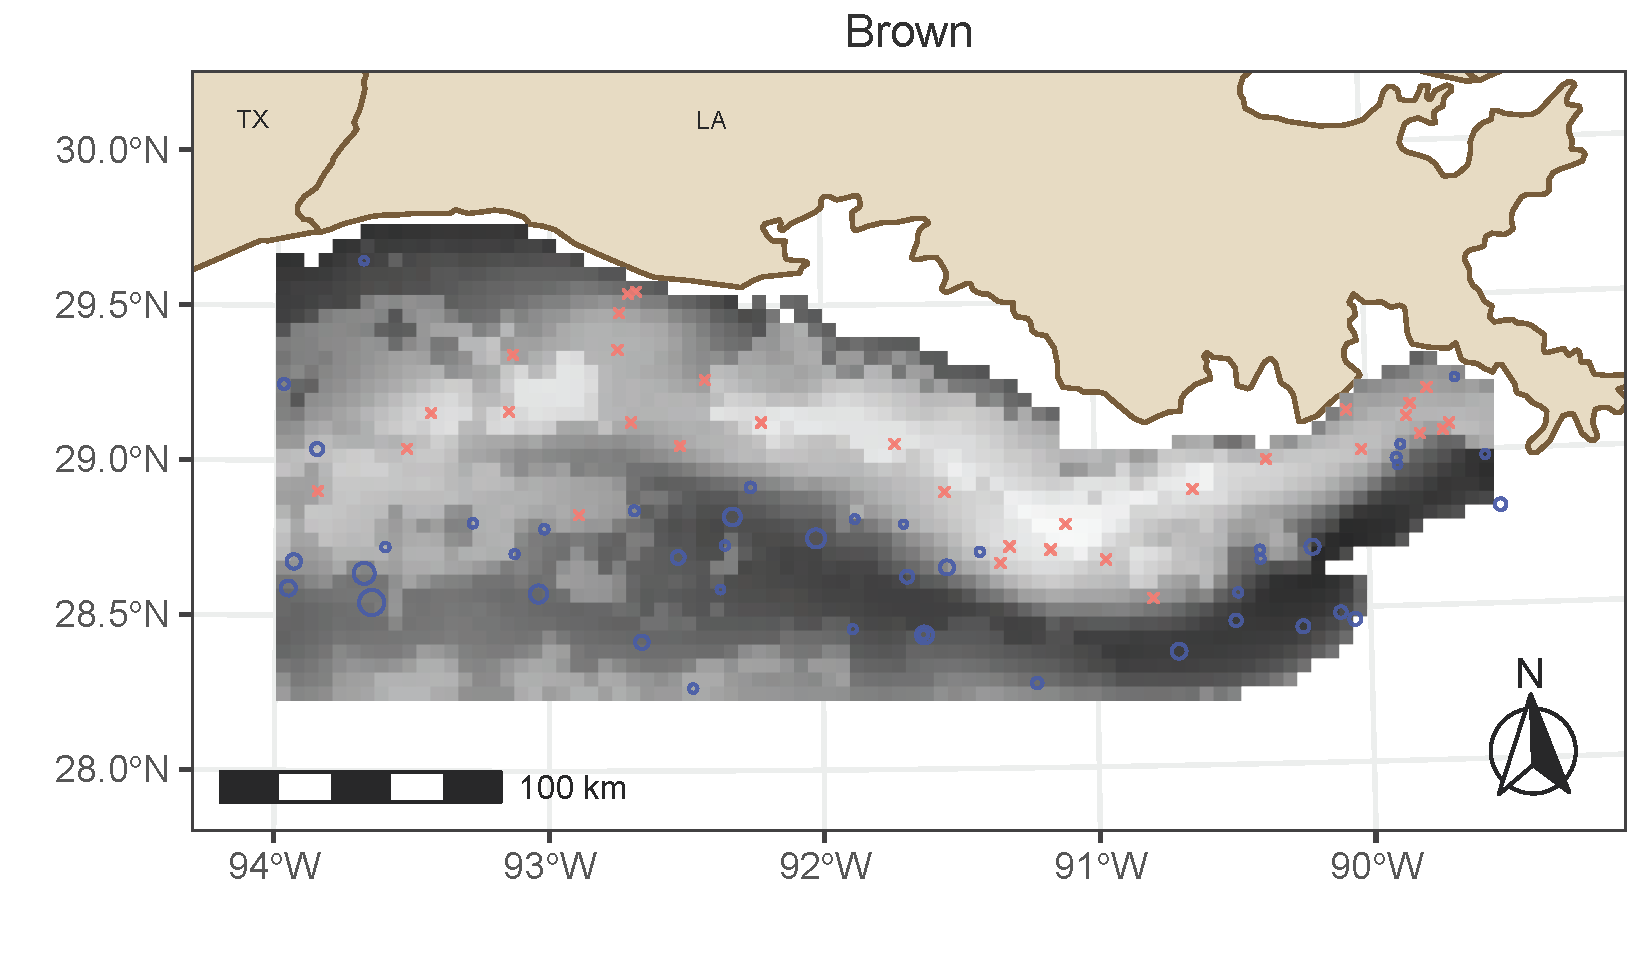
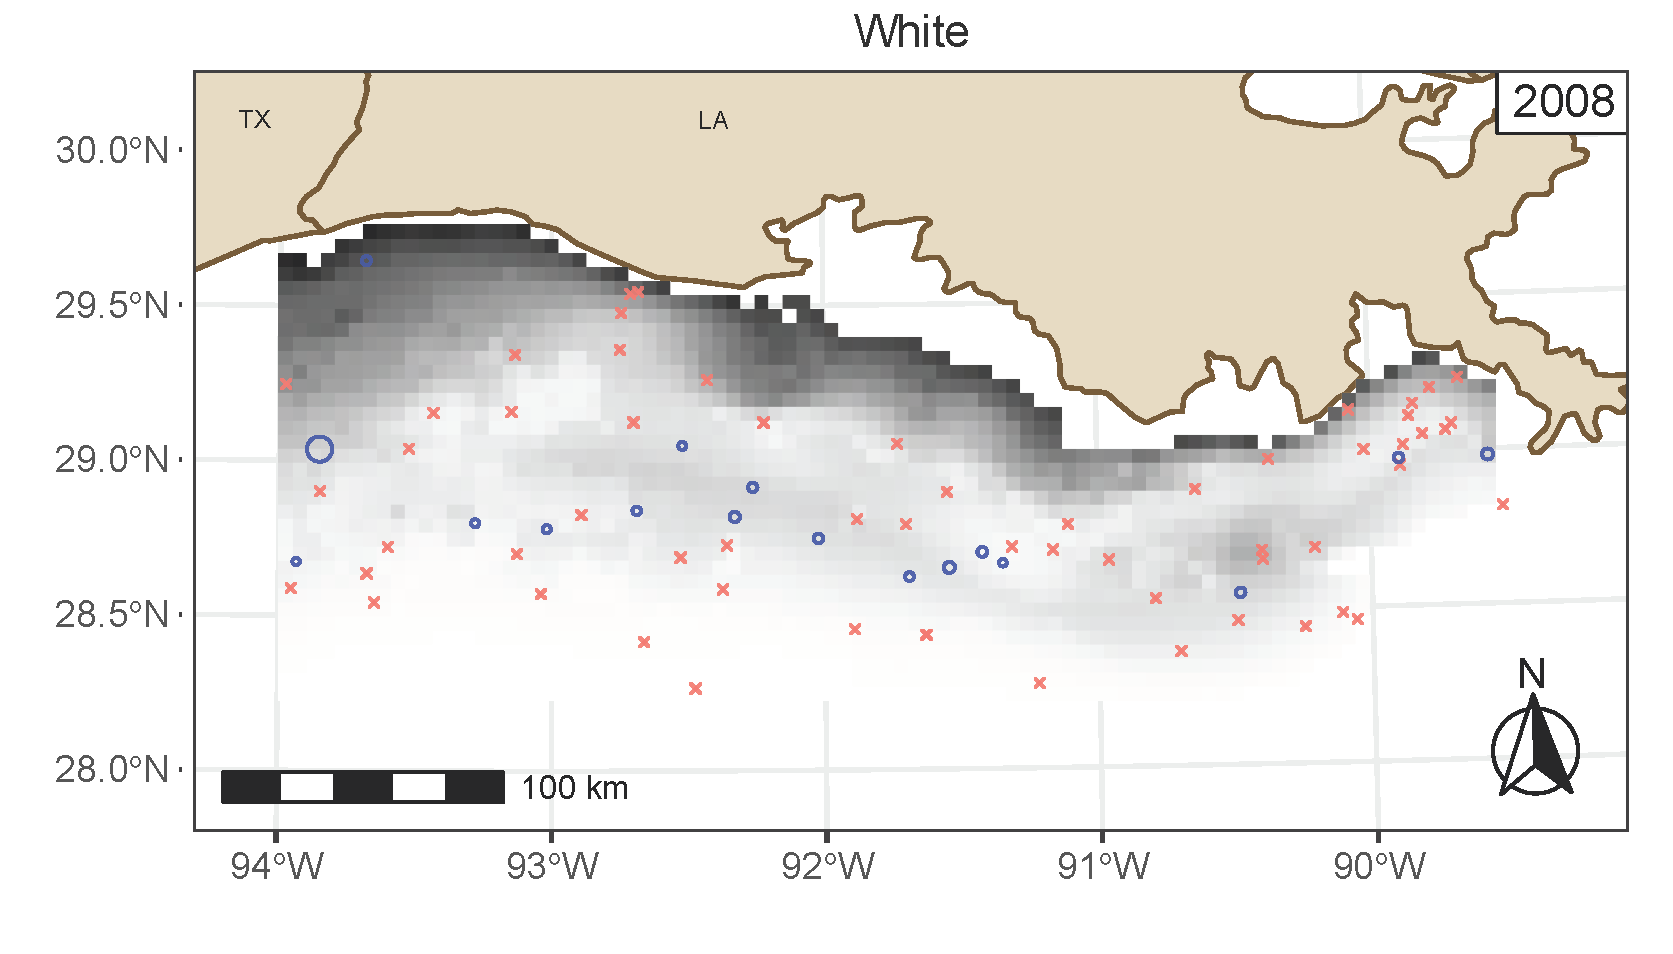
Models of brown and white shrimp on the Louisiana shelf, linking their spatial distribution to hypoxia and other environmental, water quality and human factors, fitted to survey data with Bayesian statistical models. Published in 2025 (see below).

Publications
All papers on Google Scholar. If you need the full text of any of them, email me.